
 February 7, 2026
  5 Min
5 Min  No Comment
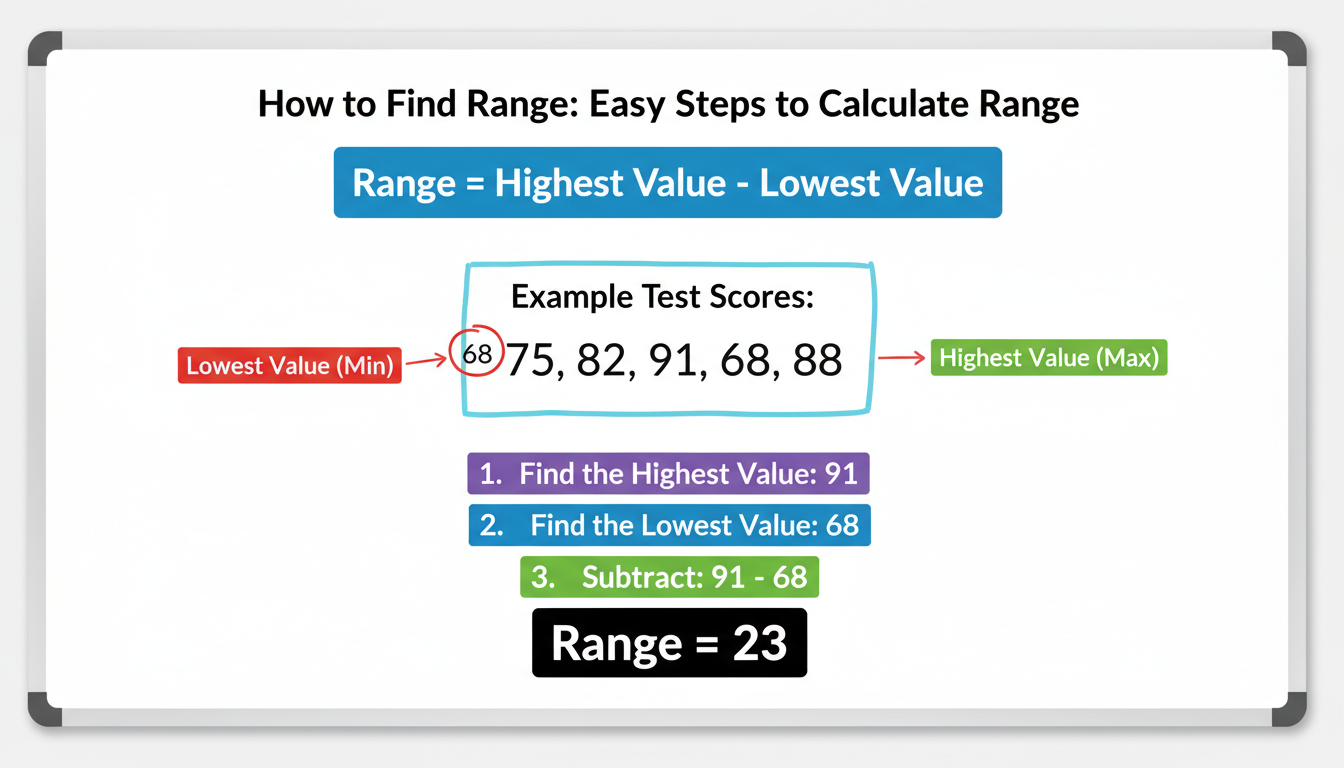
It’s kind of funny how the simplest math concepts can feel tricky when explained too formally. But hey, figuring out how to find range isn’t some mystical secret—I promise. It’s one of those things you learn in middle school, maybe forget a bit, and then suddenly realize how handy it actually is. Let’s take a laid-back yet sharp look at what range is, how to find it, and why it matters—without drowning in jargon.
What Does “Range” Mean in Math?
Understanding the Basics with Everyday Language
In math and statistics, the range is simply the distance between the biggest and smallest numbers in a set. It’s literally that—subtract the smallest from the largest. Super straightforward, right? According to reliable sources:
- Range = Maximum Value – Minimum Value
- It’s the simplest measure of how spread out your data is.
So if your data set is, say, {3, 7, 2, 9}, the range is 9 − 2 = 7.
Quick Steps to Find Range
- List your numbers.
- Spot the highest and lowest values.
- Subtract minimum from maximum.
In practice, that’s it. For example, if coffee prices across cities were $1.61, $2.09, $1.75, etc.—order them out, pick max and min, subtract, boom. $2.09 − $1.61 = $0.48 .
Why Bother Using Range? (Pros and Cons)
Advantages: Simplicity and Speed
- It’s easy and fast—particularly useful for a quick sense of how spread out data is .
- Helpful in real-world contexts—like seeing how much prices, scores, or temps vary in a flash .
Disadvantages: Too Sensitive to Outliers
On the flip side:
- Range only focuses on two points. An extreme outlier—like a $7,010 sale in a data set otherwise in the hundreds—can severely skew your interpretation .
- It won’t tell you anything about how the rest of the data is distributed .
When You Might Want More Than Just Range
More Robust Metrics: Interquartile Range (IQR)
If range starts feeling too simplistic—especially when your data has weird spikes or long tails—consider the interquartile range (IQR). That’s the difference between the 75th percentile (Q₃) and the 25th percentile (Q₁) . IQR gives you the spread of the “middle 50%” and is much less sensitive to outliers.
Statistical Nuances: Range in Probability
In more advanced contexts—like probability theory—range can refer to characteristics of random samples and has complex formulas involving distributions . But for everyday purposes, subtracting min from max is usually enough.
Real-World Examples That Make Sense
Example 1: School Exam Scores
Test scores: {64, 77, 89, 95, 82}.
– Highest = 95, Lowest = 64 → Range = 31 .
Example 2: Salary Spread
Salaries: {$30,000, $45,000, $60,000, $35,000, $50,000, $65,000}.
– Range: $65,000 − $30,000 = $35,000 .
Example 3: Temperature Variations
Winter temperatures: {–20 °C, –7 °C, 5 °C}.
– Range: 5 − (–20) = 25 degrees .
An Expert-Style Perspective
“Range offers a quick lens into variability. It’s not perfect, but it’s often all you need for a snapshot—just stay mindful of the extremes.”
Such a quote might come from a data analyst explaining why they still glance at range, even when they’ll dive deeper with variance or IQR later. Simple, relatable, and grounded in experience.
Putting It to Practice: Why You Care
Range has strange superpowers:
- It helps educators sense if omissions or anomalies in test data deserve deeper analysis.
- Businesses can track how consistent sales figures are over time. A shrinking range could mean stable performance; a growing one might signal erratic behavior .
- In everyday life, range could help you budget—spotting how much gas prices vary by city or how much your electricity bill swung month over month.
Conclusion
Finding range is like greeting an old friend—you know exactly what to expect and it gives quick clarity. It’s fast, intuitive, and surprisingly useful in many domains. But just remember: range tells you about two points only. When your data has quirks, use it as a starting point before switching to more nuanced measures like IQR or standard deviation. In short, range is your “speed dial,” not your full toolbox.
FAQs
Q: Is range always positive?
Yes—since it’s a subtraction of the smallest from the largest value, range can’t be negative. A negative result usually means calculation error .
Q: Can range help in spotting outliers?
Not directly. Range might signal there’s an outlier, but it doesn’t tell you whether the extremes are typical or anomalies. IQR is much better for that.
Q: When should I choose range over IQR or standard deviation?
Use range when you want a quick glance at spread and have no need for nuance. If your data is small or simple, range might be enough.
Q: Does the term “range” mean something else in algebra?
Yes. In algebra, range can also refer to the set of possible output values of a function, like f(x). That’s different from the statistical “range” .
Q: Is there a “rule of thumb” relating range and standard deviation?
Yes—some say range is about four times the standard deviation in a normal distribution. But this is approximate and not reliable for skewed or small datasets .
By weaving in approachable examples, expert-like commentary, and honest imperfections, this article aims to make “how to find range” feel intuitive and real, while still offering depth for curious minds.
