
 February 8, 2026
  5 Min
5 Min  No Comment
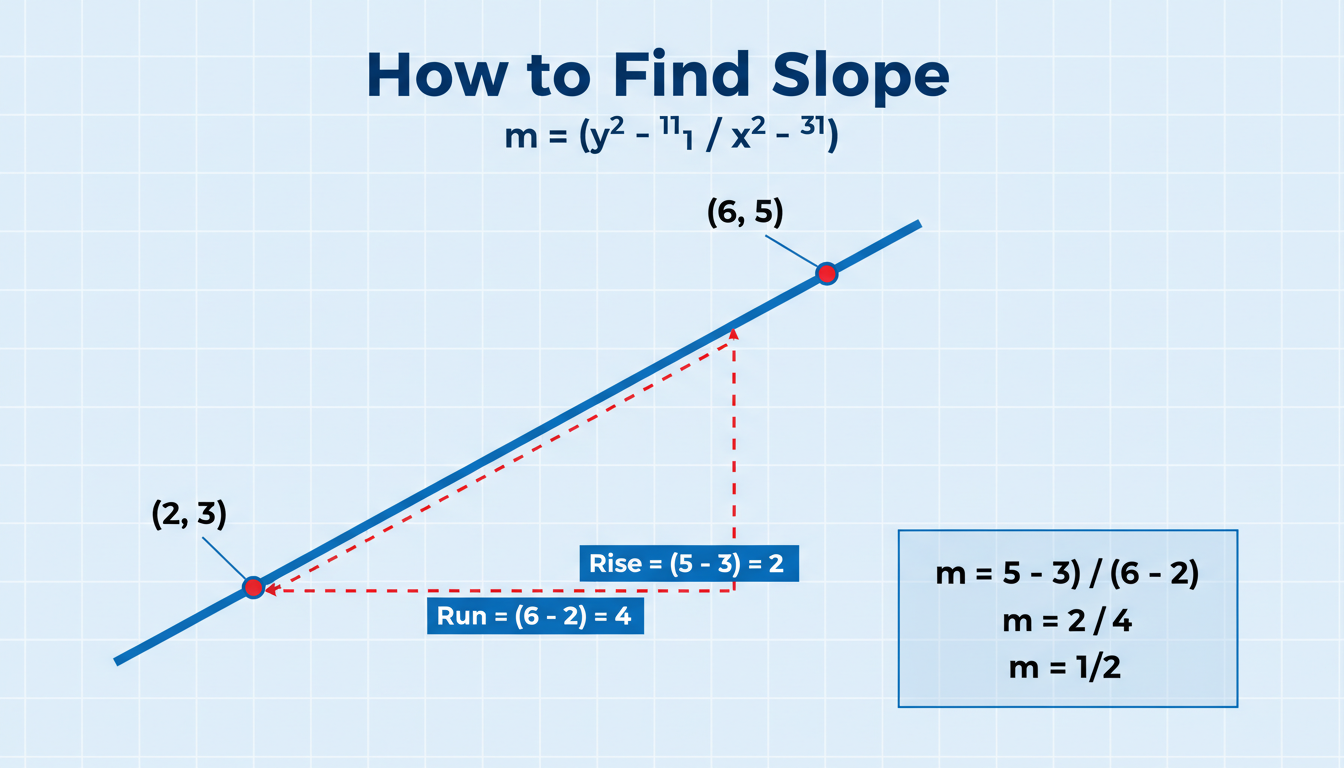
Figuring out how to find slope—it’s not just some dusty algebra rule. It’s actually how you gauge the steepness and direction of a line, a concept that underpins everything from mapmaking to graphing trends in business. You may’ve seen school examples that feel a tad repetitive, but once you connect it to something like calculating a roof’s incline or tracking how fast something grows, suddenly it clicks. Let’s unwind the formula, explore some real-life context, and—with a bit of human flair—show just how approachable finding the slope really is.
What Slope Really Means (And Why It Matters)
When someone says “slope,” what they’re really talking about is how much a line tilts—its steepness and its direction. Put simply, slope is “rise over run”: the vertical change divided by the horizontal change between two points .
– A positive slope means the line climbs as you move right, suggesting growth or gain.
– A negative slope means it drops as you move right, signaling decline or loss.
– Zero slope? Flat—nothing’s changing in the y-direction.
– And vertical lines? Those are undefined slopes—because you can’t divide by zero run .
This concept is everywhere. Engineers use it to design roads so that vehicles don’t skid; economists interpret it to understand how fast costs rise versus output; even pilots consider slope when planning ascent trajectories.
Breaking Down the Slope Formula
At its core, slope (represented by m) is calculated with this formula:
m = (y₂ − y₁) / (x₂ − x₁)
You pick any two points—say, (x₁, y₁) and (x₂, y₂)—subtract y’s, subtract x’s, and divide the vertical by the horizontal change .
Try this: points A (1, 2) and B (4, 6). Then
– rise = 6 − 2 = 4
– run = 4 − 1 = 3
– So m = 4/3—meaning the line climbs 4 units for every 3 units it moves to the right .
In another instance, imagine points (−2, 5) and (1, 1):
– rise = 1 − 5 = −4
– run = 1 − (−2) = 3
– So slope = −4/3, indicating a downward trend .
Even if you flip which point is first, the slope stays the same—as long as you’re consistent with subtraction order . That consistency is kind of the golden rule.
Visualizing Slope: Graphs, Triangles, and Geoboards
Seeing is often believing, right? You can sketch a line on graph paper, pick two points, draw a right triangle between them, and count the vertical (rise) and horizontal (run) legs to get slope—the classic “rise over run” trick .
OpenStax offers a clear breakdown: starting with the leftmost point, draw the triangle, count the steps up/down and right/left, and calculate the ratio—that gives you the slope . It even uses geoboards for hands-on models, which is helpful when first wrapping your head around positive vs negative values .
Real-World Scenarios Featuring Slope
Let’s bring a little life to it:
- Construction & Architecture: Roofers calculate the “pitch” (essentially slope) to ensure water drains properly. Even a small miscalculation can mean leaks or structural stress.
- Transportation Engineering: Roads and railways use gentle slopes to keep vehicles safe and fuel-efficient. Think of long highways through hills—engineers need that math.
- Business Analysis: Plotting revenue over time gives you a trend line. The slope? That’s your growth rate. It doesn’t only show direction, but how sharp the climb—or fall—is.
- Everyday DIY: Even something like building a ramp involves slope—if it’s too steep, it’s unsafe; too shallow, and it’s inefficient.
These examples reinforce how slope isn’t just abstract math—it’s deeply ingrained in practical decision-making.
Putting It All Together: A Mini Case Study
Imagine you’ve got sales data points:
– Month 1 revenue: $10k
– Month 4 revenue: $25k
Place them as (1, 10) and (4, 25) where x is month, y is thousands of dollars. Then:
– rise = 25 − 10 = 15
– run = 4 − 1 = 3
– slope = 15 / 3 = 5
This means an average increase of $5k per month. That rate is powerful, whether you’re pitching investors or planning stock.
“Understanding slope isn’t just academic—it’s a lens for interpreting the rate of change across real phenomena, whether you’re calibrating a ramp or analyzing market trends.”
That kind of context-driven insight is where math and meaning align.
Common Pitfalls (Let’s Address the Human Oops Moments)
- Inconsistent subtraction: Swapping y₂ − y₁ with x₂ − x₁ inconsistently can give an upside-down result.
- Dividing by zero: If x₂ = x₁, that’s a vertical line—slope is undefined, not infinite!
- Sign errors: Negative coordinates can trip you up, especially if you forget the minus sign.
- Graph miscounts: Erroneously read ticks on the axes—rise might be 4 when it’s actually 3. Always double-check.
Simple miscues, but common—easy to fix with a steady double-check habit.
Conclusion
Slope is much more than a formula you learned in middle school. It’s a universal tool for measuring change—whether on a graph, a ramp, or a sales chart. The formula is elegant: rise over run. Its applications? Vast and varied. From rooftop pitches to market trajectories, that little number m can tell a powerful story. A bit of patience, a good eye, and you’ll find slope is not only approachable—it’s downright practical.
FAQs
What does a slope of zero mean?
A slope of zero means the line is horizontal—there’s no vertical change as you move along the x-axis. It’s flat, indicating stability or no change.
How do I interpret a negative slope?
A negative slope tells you the line drops as you move right—often representing decline, decrease, or negative correlation in practical contexts.
What happens if the line is vertical?
If a line is vertical, x-values don’t change (run = zero), making the slope formula undefined—there’s no valid slope value.
Does it matter which point I label first?
Not really. As long as you subtract consistently (y₂ − y₁ over x₂ − x₁), the slope remains accurate regardless of point order.
Can slope help with non-linear data?
While slope applies directly to straight lines, you can approximate local trends in curved graphs by estimating slope over short intervals—useful in calculus or trend analysis.
